|
Objectives:
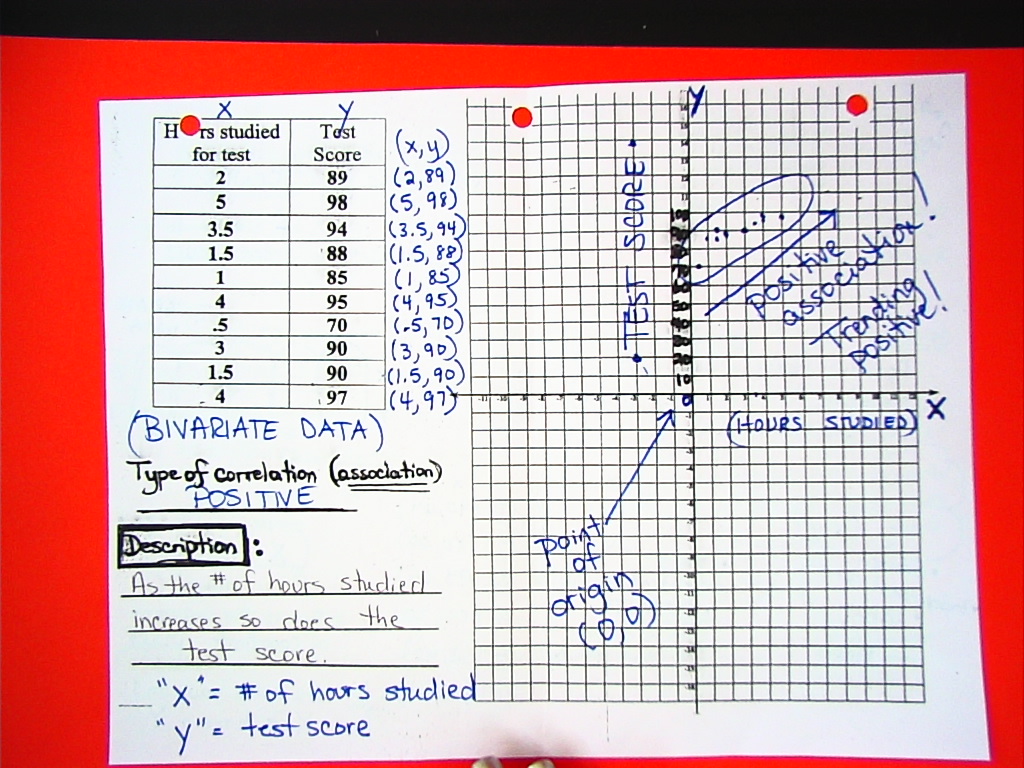
8.SP.1: Construct and interpret scatter plots for bivariate measurement data to investigate patterns of association between two quantities. Describe patterns such as clustering, outliers, positive or negative association, linear association, and nonlinear association. 8.SP.2: Know that straight lines are widely used to model relationships between two quantitative variables. For scatter plots that suggest a linear association, informally fit a straight line, and informally assess the model fit by judging the closeness of the data points to the line. |

Monday - Teacher Workday (No School for Students) Tuesday - Teacher Workday (No School for Students) Wednesday 11-5-2014
Students will practice how to plot points concerning the relationship between two sets of data and interpret the association created from the data. 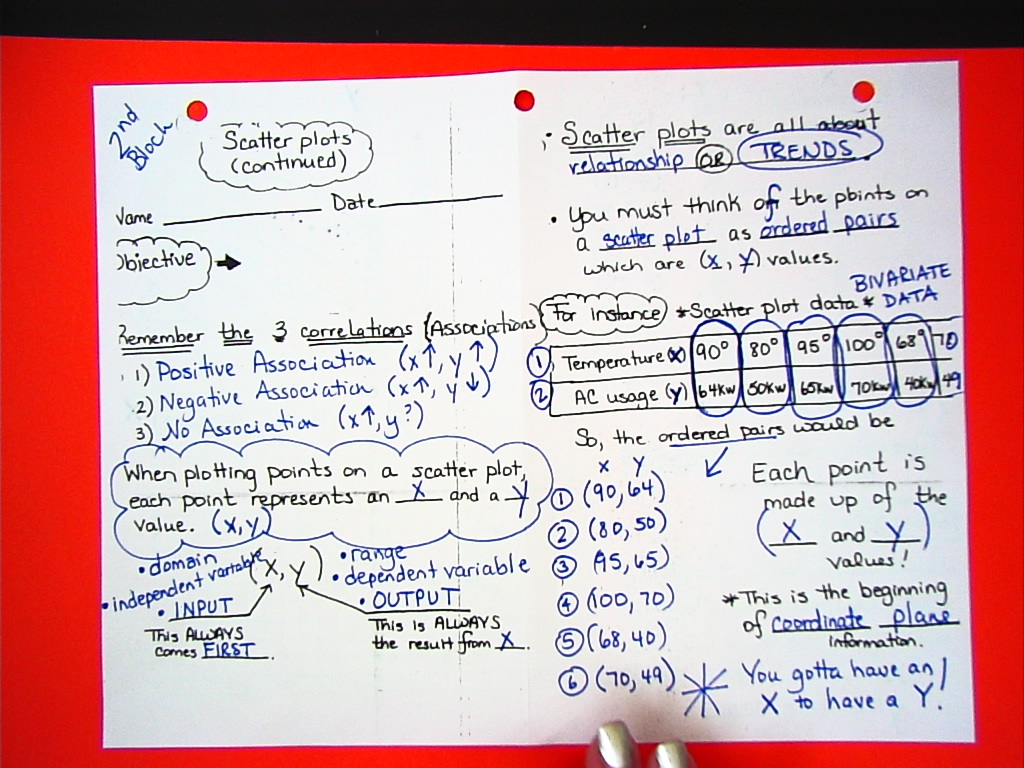
Thursday 11-6-2014
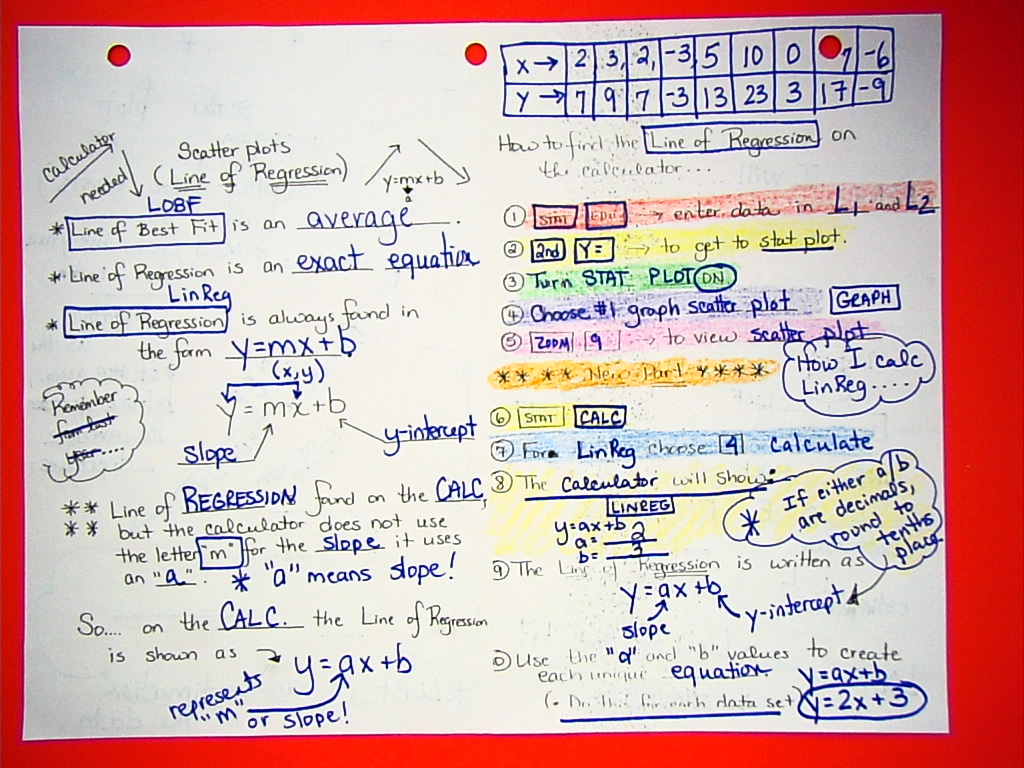
Students will practice how to plot points concerning the relationship between two sets of data and interpret the association created from the data using a TI-84 plus calculator. Students will also collect class data measuring the height and shoe length of each student in the room and plot all of the points from this data on a graph. 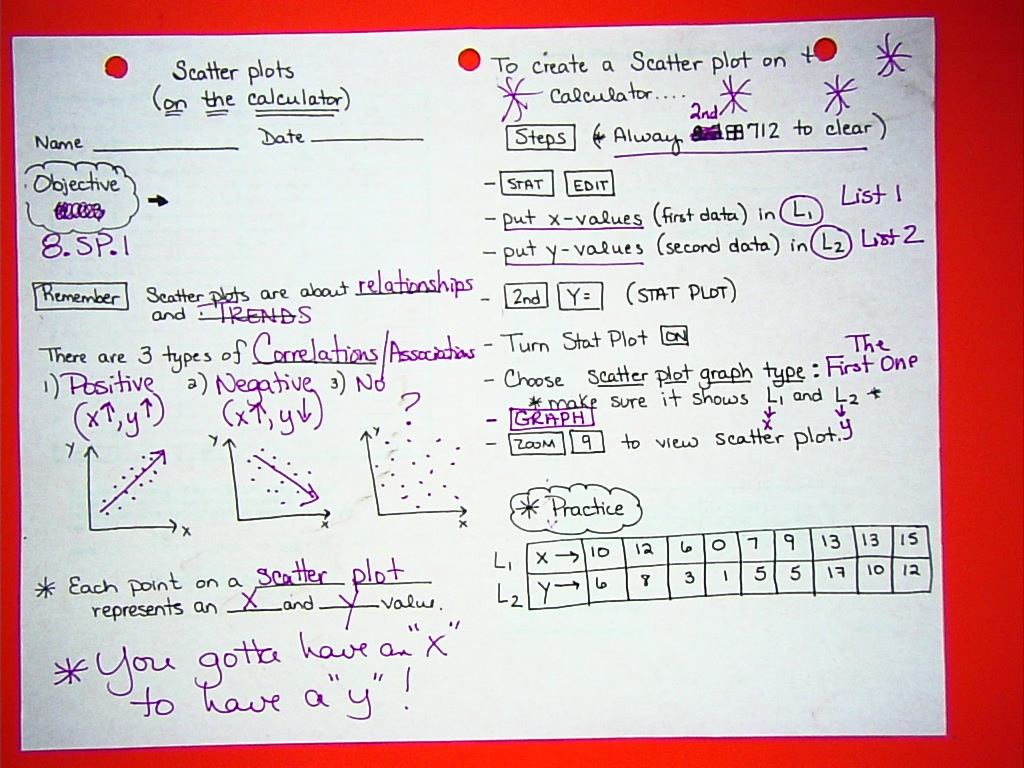
Friday 11-7-2014
Students will learn how to find the Line of Best Fit on a scatterplot of Bivariate Data. They will also draw a LOBF for the data that they collected yesterday on the height vs. show length activity. 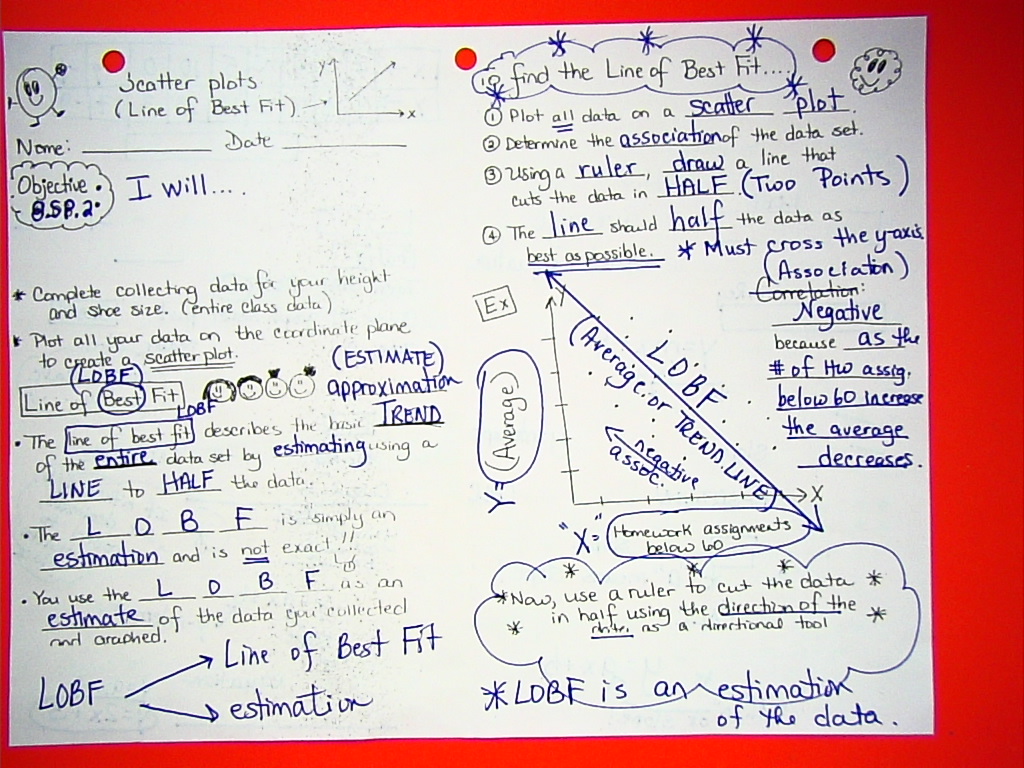
|