|
November
17-21 Objectives
8.SP.1: Construct and interpret scatter plots for bivariate measurement data to investigate patterns of association between two quantities. Describe patterns such as clustering, outliers, positive or negative association, linear association, and nonlinear association. 8.SP.2: Know that straight lines are widely used to model relationships between two quantitative variables. For scatter plots that suggest a linear association, informally fit a straight line, and informally assess the model fit by judging the closeness of the data points to the line. 8.SP.3: Use the equation of a linear model to solve problems in the context of bivariate measurement data, interpreting the slope and intercept. 8.SP.4: Understand that patterns of association can also be seen in bivariate categorical data by displaying frequencies and relative frequencies in a two-way table. Construct and interpret a two-way table summarizing data on two categorical variables collected from the same subjects. Use relative frequencies calculated for rows or columns to describe possible association between the two variables. |
Monday 11-17-2014
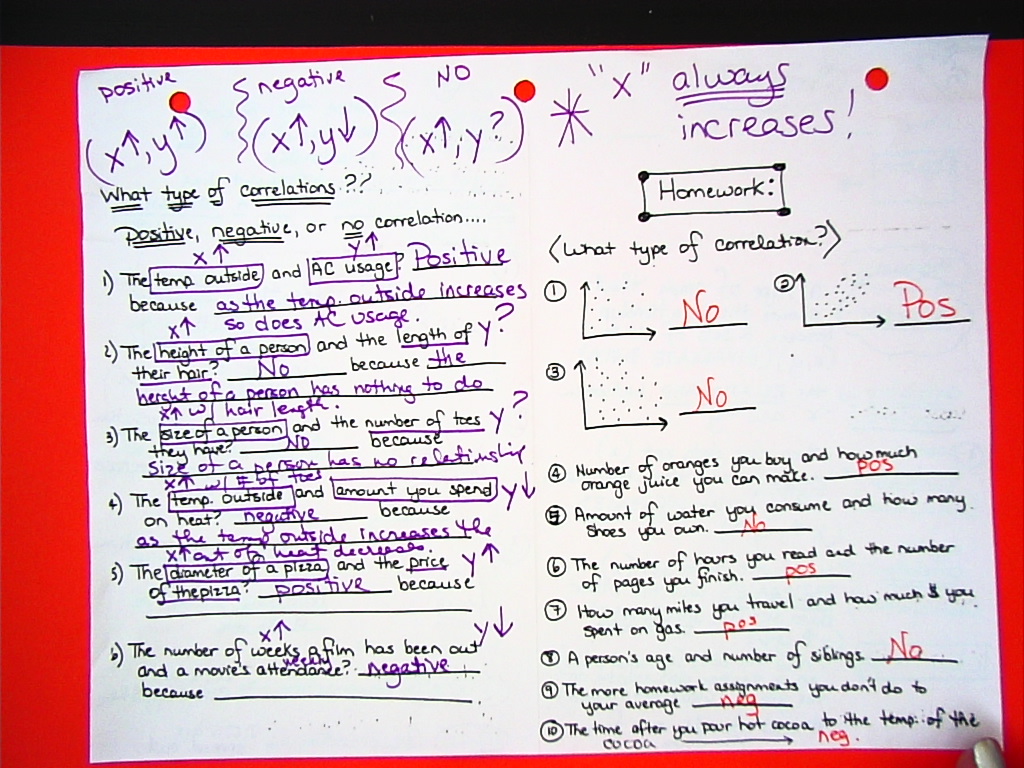
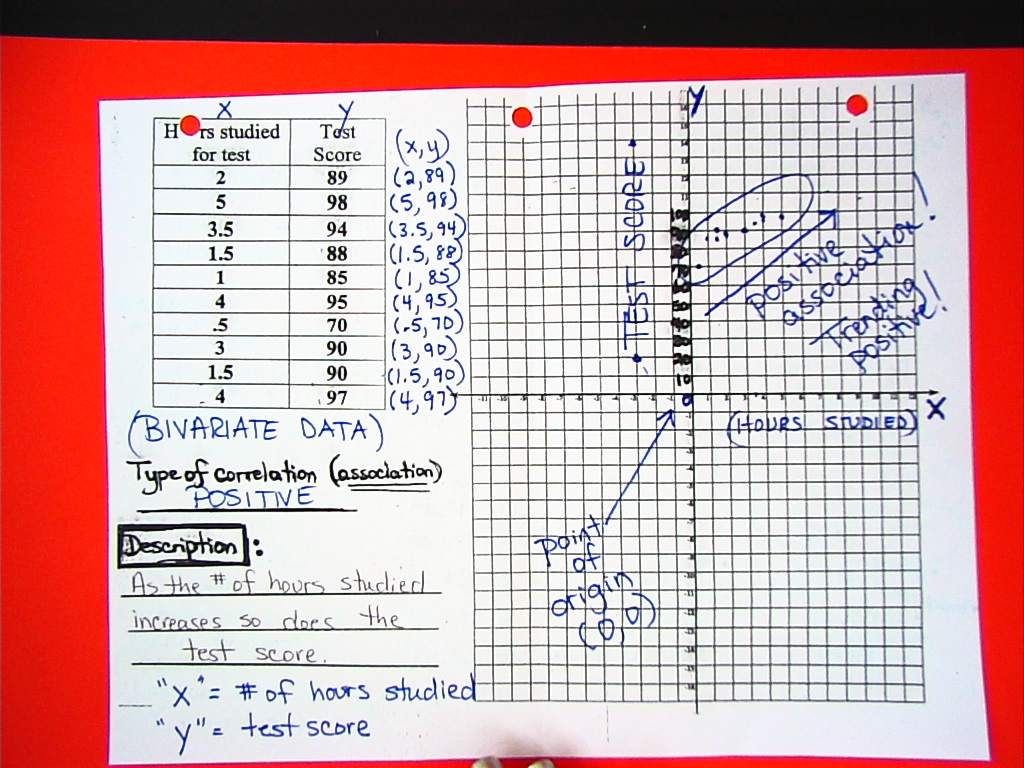
Students will plot ordered pairs on a coordinate grid representing the relationship between two data sets. *describe patterns in the plotted points, such as clustering, outliers, positive or negative association, and linear or nonlinear association, and describe the pattern in the context of the measurement data. *interpret the patterns of association in the context of the data sample. 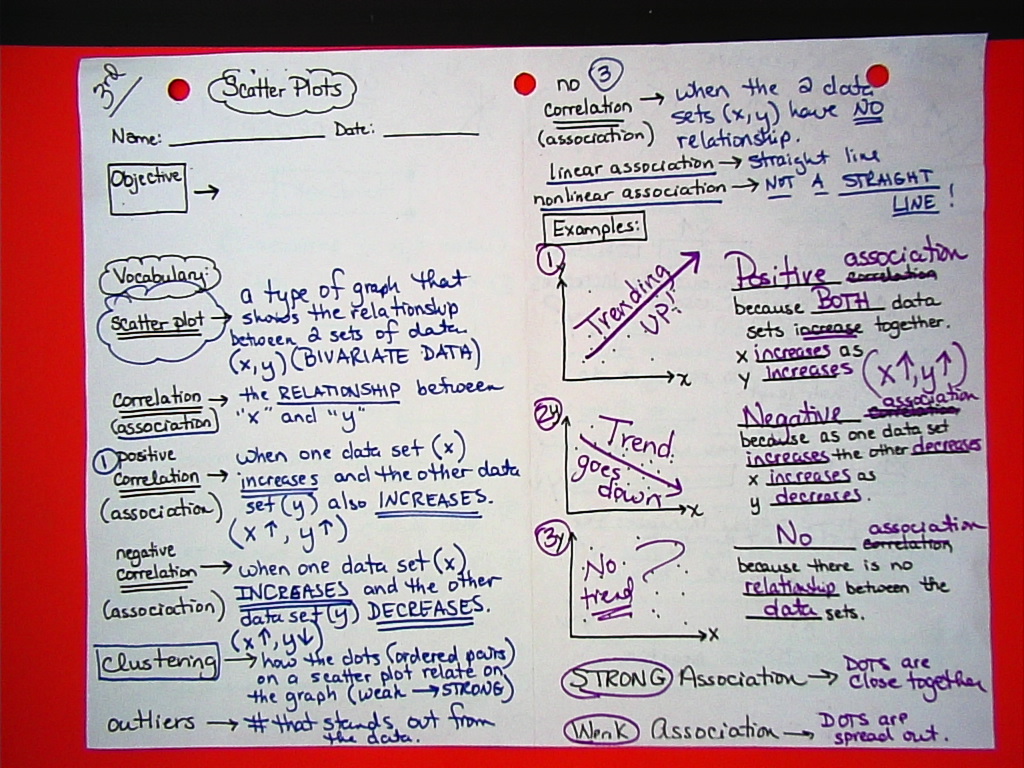
Tuesday 11-18-2014
Students will plot ordered pairs on a coordinate grid representing the relationship between two data sets. *describe patterns in the plotted points, such as clustering, outliers, positive or negative association, and linear or nonlinear association, and describe the pattern in the context of the measurement data. *interpret the patterns of association in the context of the data sample 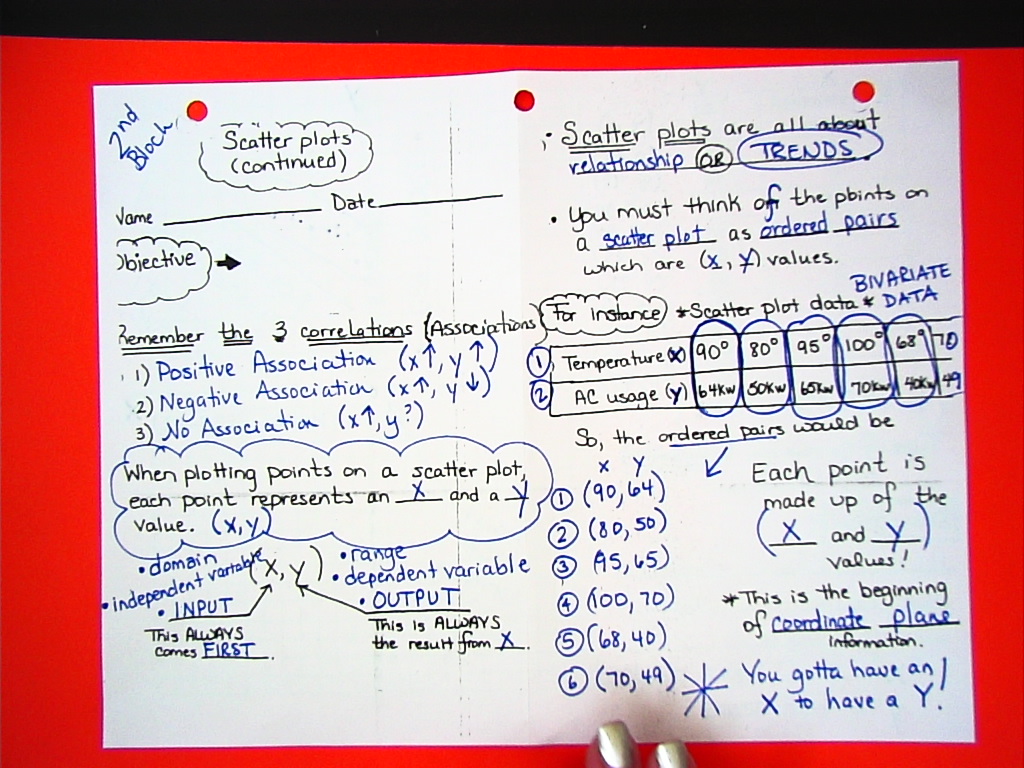
Wednesday 11-19-2014
Students will plot ordered pairs on a coordinate grid representing the relationship between two data sets. *describe patterns in the plotted points, such as clustering, outliers, positive or negative association, and linear or nonlinear association, and describe the pattern in the context of the measurement data. *interpret the patterns of association in the context of the data sample 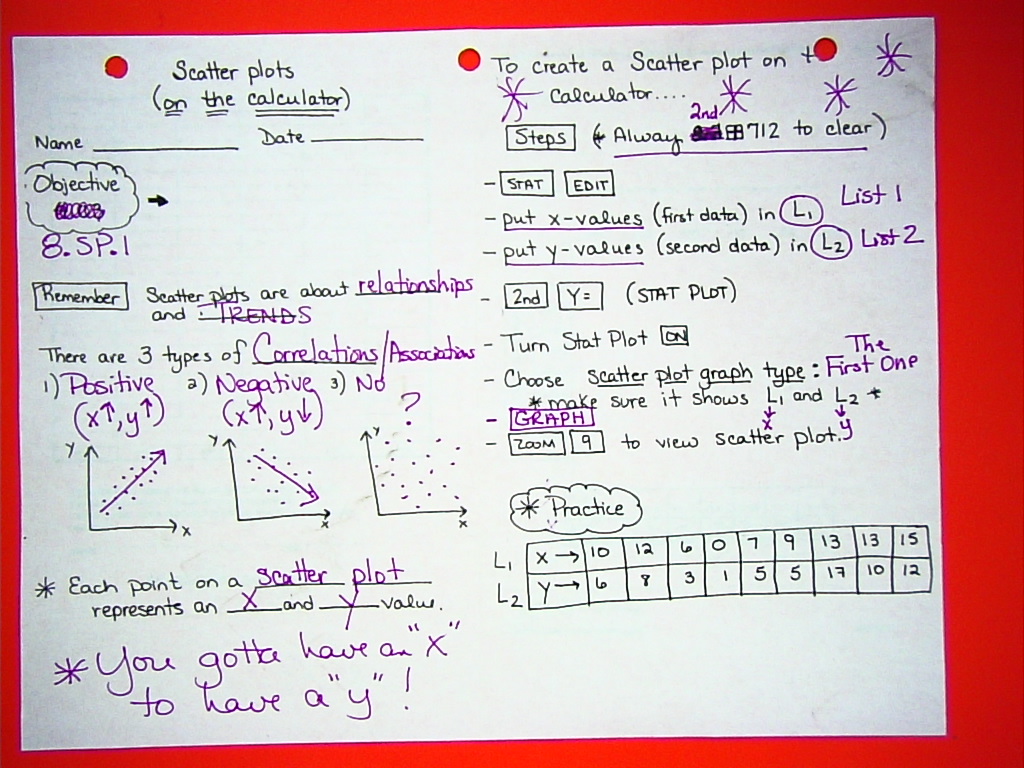
Thursday 11-20-2014
Students will recognize whether or not data plotted on a scatter plot have a linear association. *draw a straight trend line to approximate the linear relationship between the points of the two data sets. *make inferences regarding the reliability of the trend line by noting the closeness of the data points to the line. 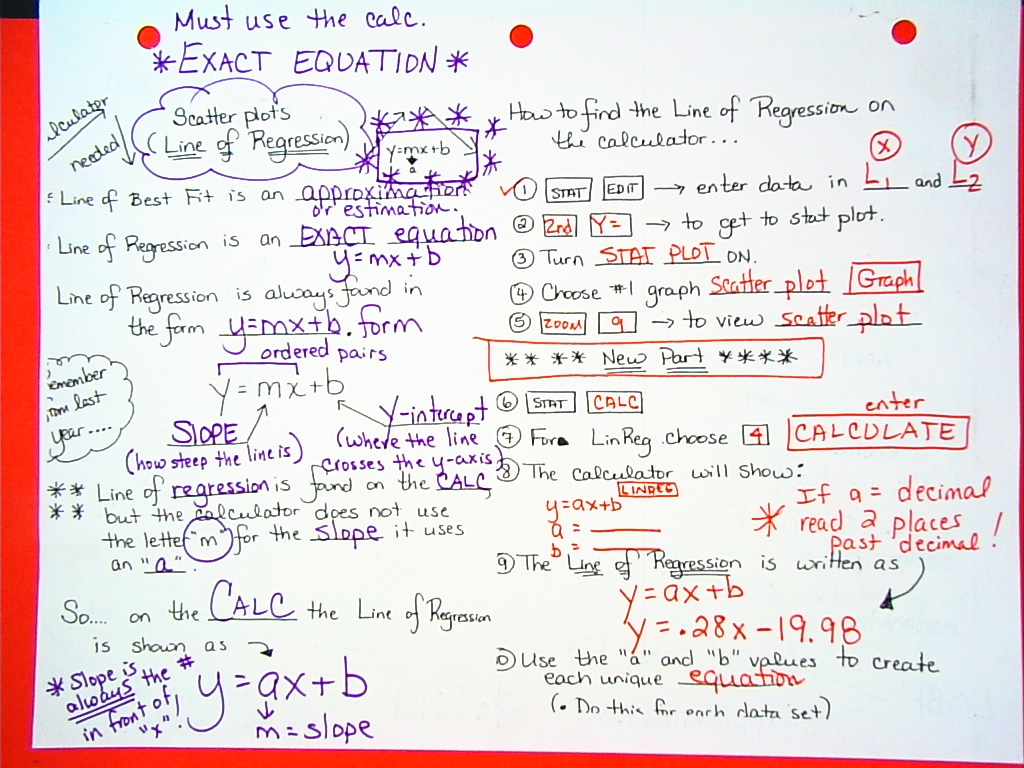
Friday
11-21-2014
Students will work on various lessons on Study Island during class today. |