|
Math I November
10-14 Objectives:
S.ID.1: Represent data with plots on the real number line (dot plots, histograms, and box plots). S.ID.2: Use statistics appropriate to the shape of the data distribution to compare center (median, mean) and spread (interquartile range, standard deviation) of two or more different data sets. S.ID.3: Interpret differences in shape, center, and spread in the context of the data sets, accounting for possible effects of extreme data points (outliers). |
Monday
11-10-2014
Students were introduced to Box Plots, Histograms, and Dot plots, as well as Data Distribution. Tuesday 11-11-2014
HAPPY VETERANS' DAY 
Wednesday
11-12-2014
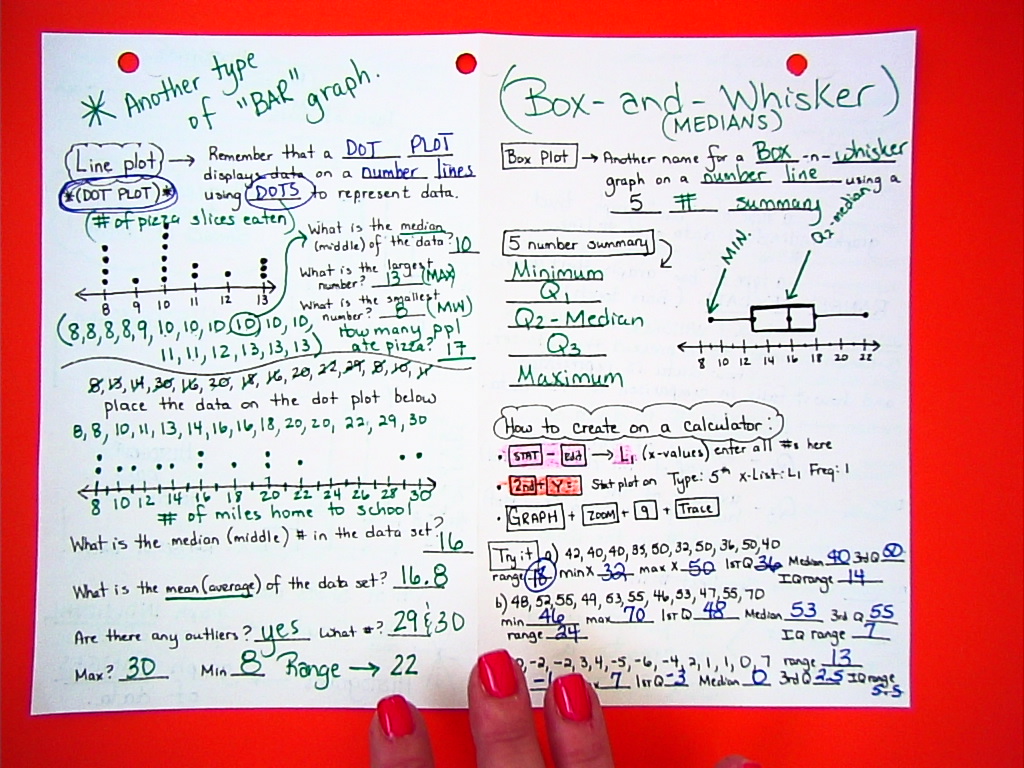
Students will choose the best representation (dot plot, histogram, box plot) for a set of data. *decide if a representation preserves all the data values or presents only the general characteristics of a data set. Dot plot: *choose the appropriate scale to represent data on a number line. *construct a dot plot for a set of data. Histogram: *construct a histogram for a set of data. Box plot: *calculate the 5-number summary for a set of data. *construct the box plot based on the 5-number summary. 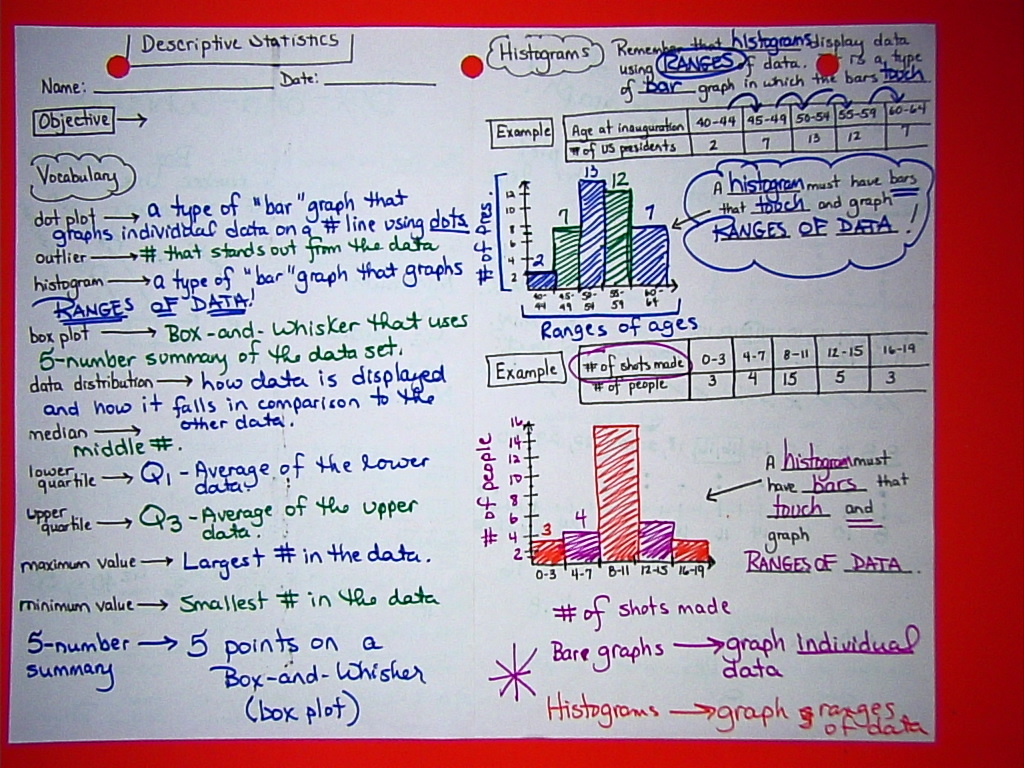
Thursday
11-13-2014
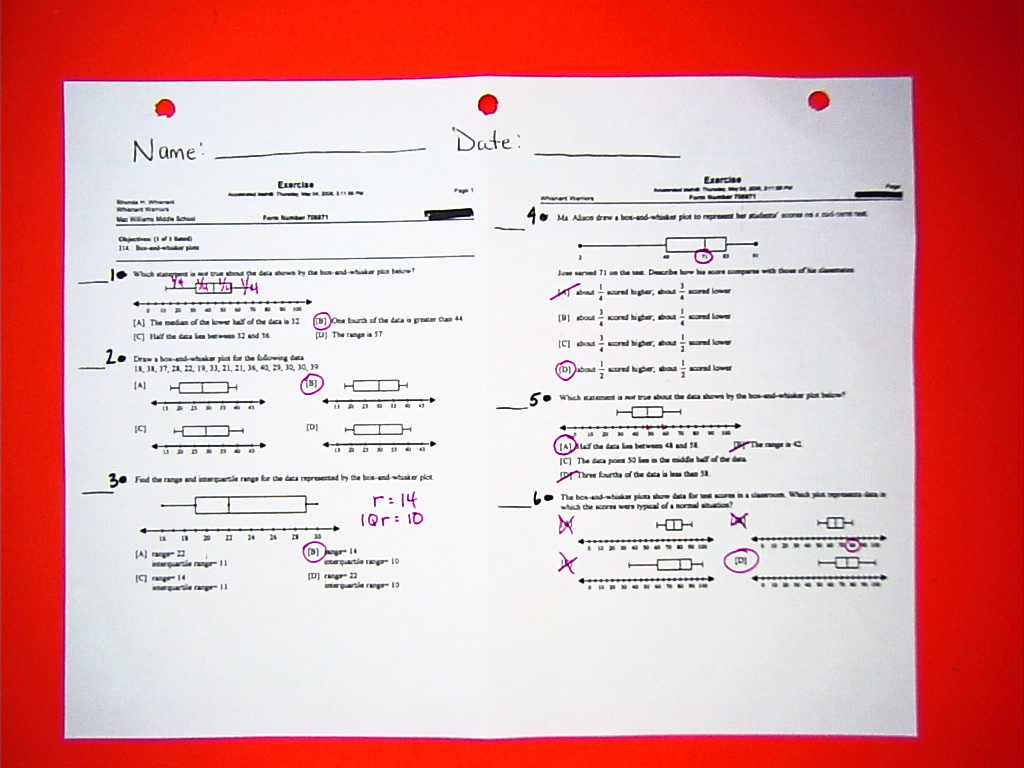
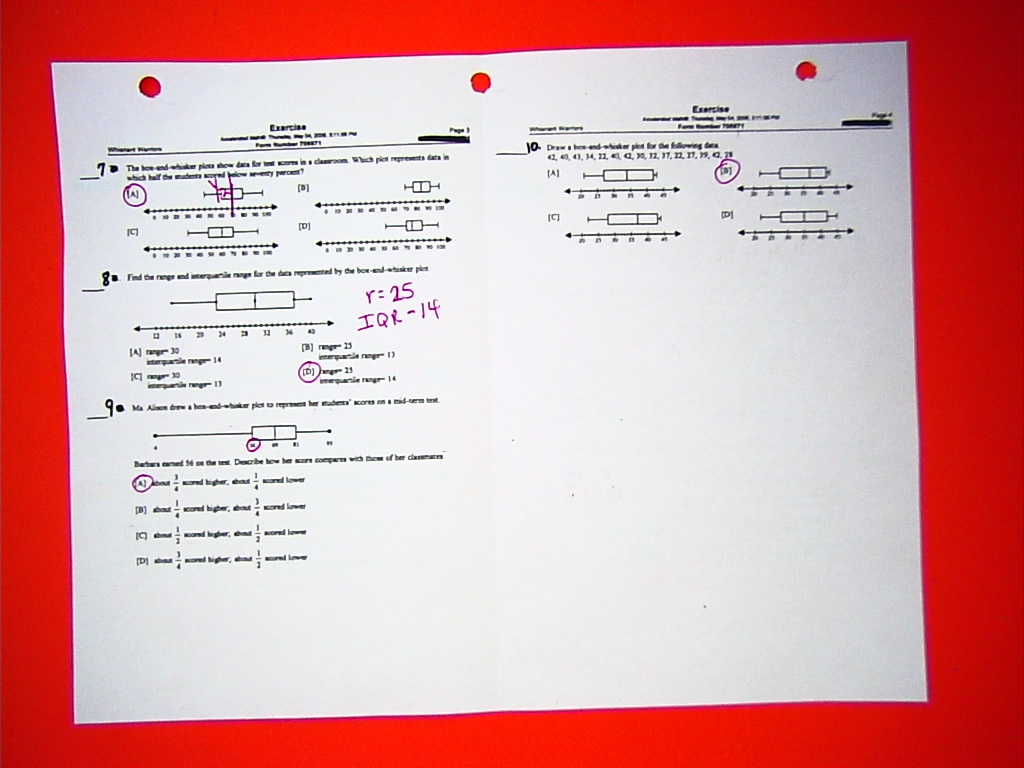
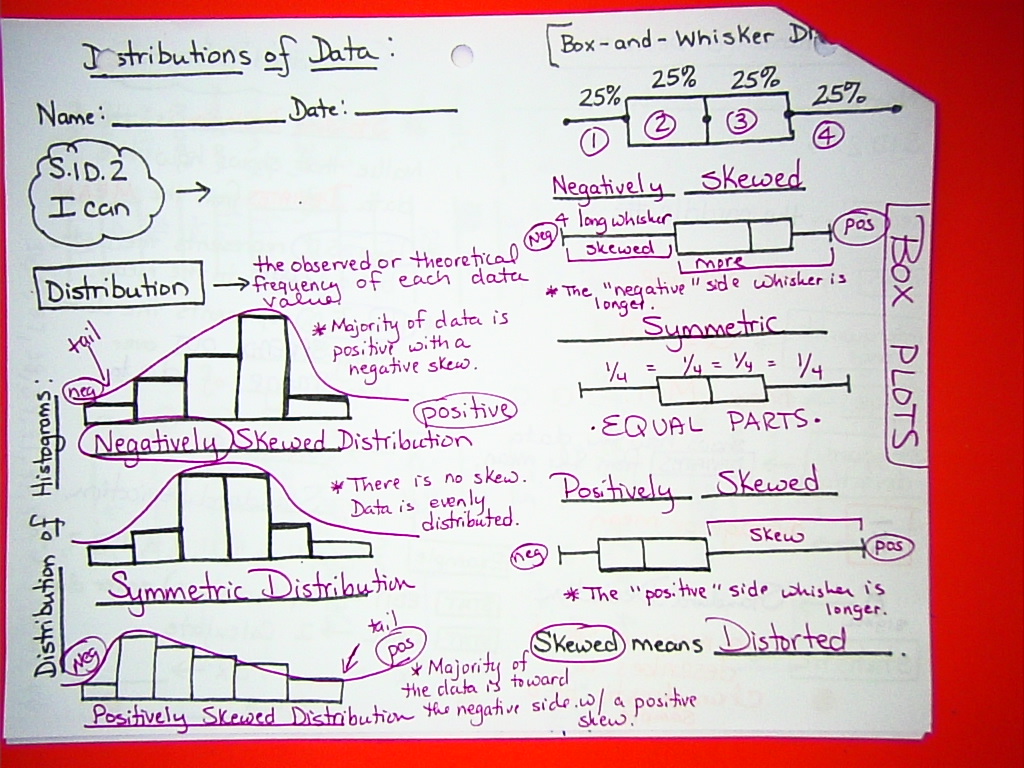
Students will describe the center of the data distribution (mean or median). *choose the histogram with the largest mean when shown several histograms. *describe the spread of the data distribution (interquartile range or standard deviation). *choose the histogram with the greatest standard deviation when shown several histograms. *choose the box-and-whisker plot with the greatest interquartile range when shown several box-and-whisker plots. *compare the distributions of two or more data sets by examining their shapes, centers, and spreads when drawn on the same scale 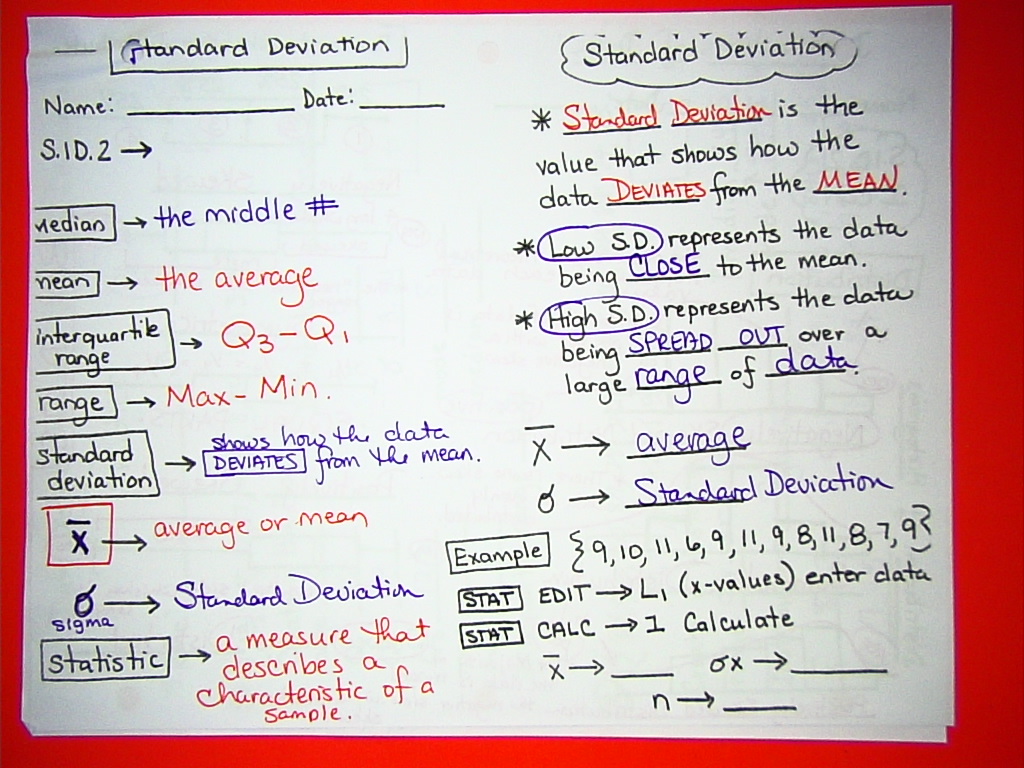
Friday
11-14-2014
Students will take an assessment on Data Distribution, Inequalities, and Rational Exponents. |