|
Objectives this week:
8.SP.4: Understand that patterns of association can also be seen in bivariate categorical data by displaying frequencies and relative frequencies in a two-way table. Construct and interpret a two-way table summarizing data on two categorical variables collected from the same subjects. Use relative frequencies calculated for rows or columns to describe possible association between the two variables. 8.EE.5: Graph proportional relationships, interpreting the unit rate as the slope of the graph. Compare two different proportional relationships represented in different ways. 8.EE.6: Use similar triangles to explain why the slope m is the same between any two distinct points on a non-vertical line in the coordinate plane; derive the equation y = mx for a line through the origin and the equation y = mx + b for a line intercepting the vertical axis at b. |
Monday 11-17
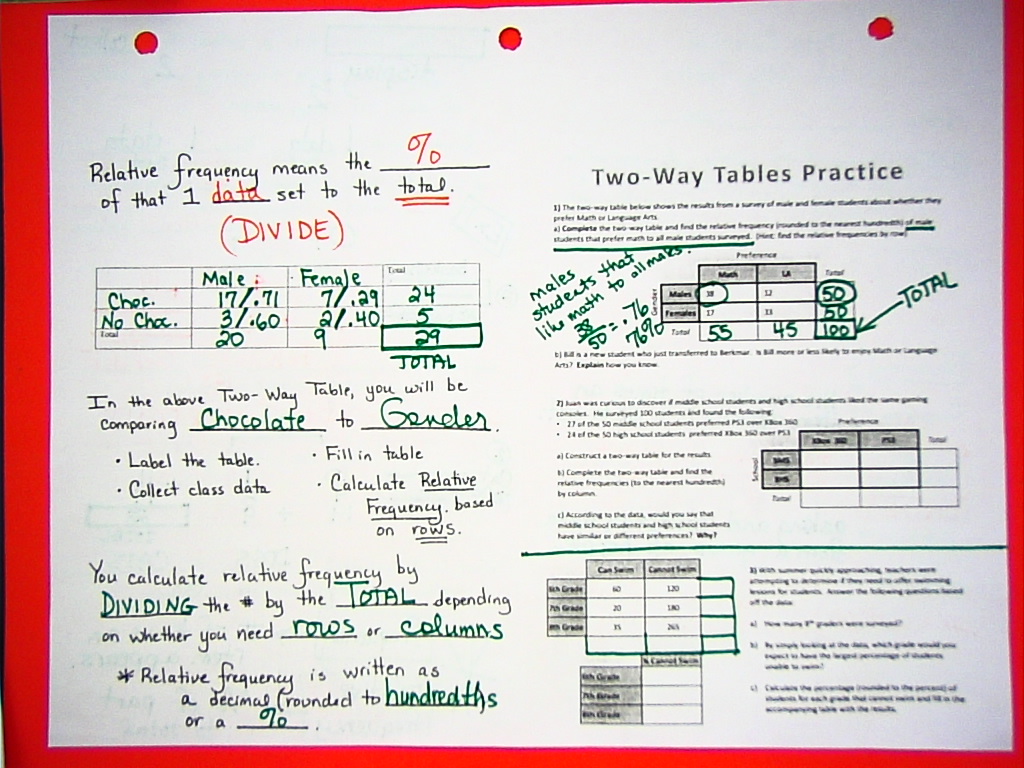
Students will create a two-way table to record the frequencies of bivariate categorical values, determine the relative frequencies for rows and/or columns of a two-way table, and use the relative frequencies and context of the problem to describe possible associations between the two set of data. 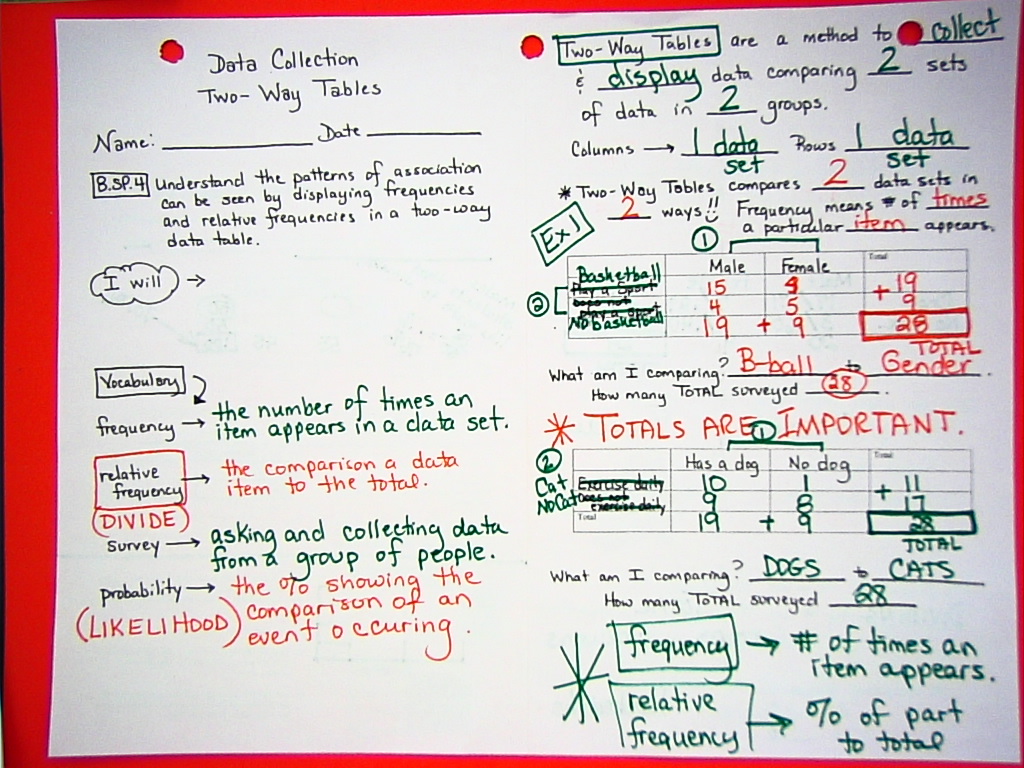
Tuesday 11-15-2014
Students practiced creating and analyzing Two-Way Tables. Wednesday 11-19-2014
Students will graph a proportional relationship (slope) in the coordinate plane, interpret the unit rate of a proportional relationship as the slope of the graph, and use a graph, a table, or an equation to determine the unit rate of a proportional relationship and use the unit rate to make comparisons between various proportional relationships Thursday 11-20-2014 Students will learn more about slope-intercept equations and justify that an equation in the form y=mx+b represents the graph of a linear relationship with a slope of m and a y-intercept of b. Friday 11-21-2014
Mrs. Whisnant will not be at school today. Students will complete several assignments on Study Island that have been loaded for them to complete. |