|
Objectives:
8.SP.1: Construct and interpret scatter plots for bivariate measurement data to investigate patterns of association between two quantities. Describe patterns such as clustering, outliers, positive or negative association, linear association, and nonlinear association. 8.SP.2: Know that straight lines are widely used to model relationships between two quantitative variables. For scatter plots that suggest a linear association, informally fit a straight line, and informally assess the model fit by judging the closeness of the data points to the line. |
Monday 11-10-14
Student learned to recognize whether or not data plotted on a scatter plot have a linear association. They drew a straight trend line to approximate the linear relationship between the points of the two data sets and made inferences regarding the reliability of the trend line by noting the closeness of the data points to the line. 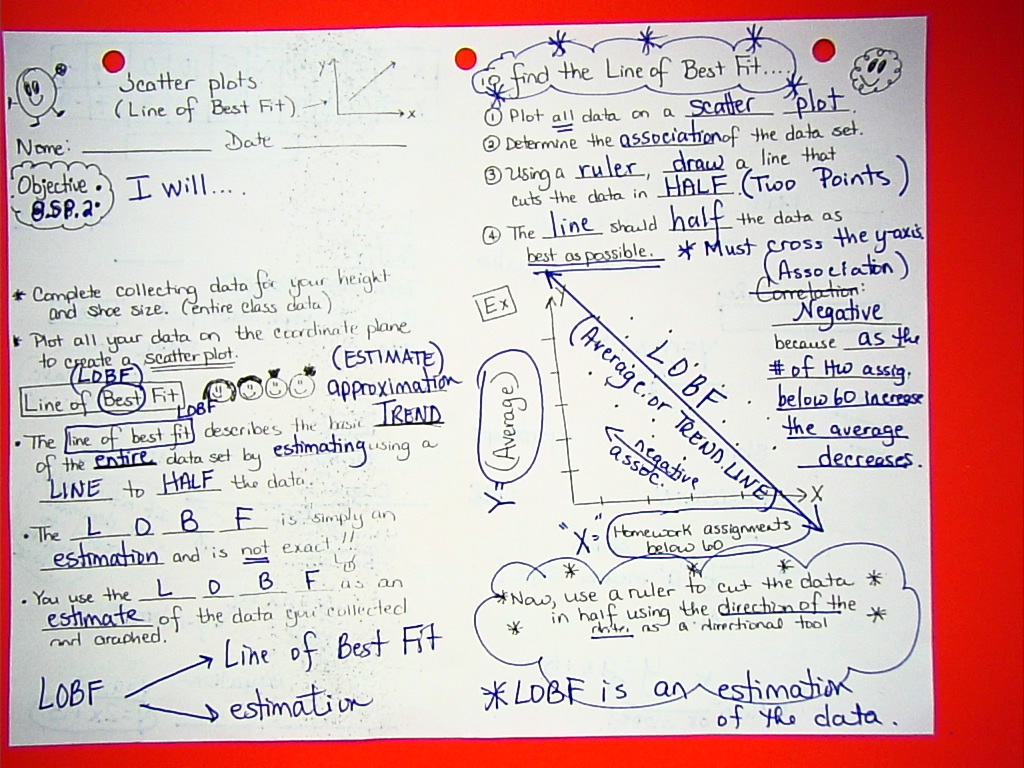
Tuesday 11-11-2014
HAPPY VETERAN'S DAY |
|
|

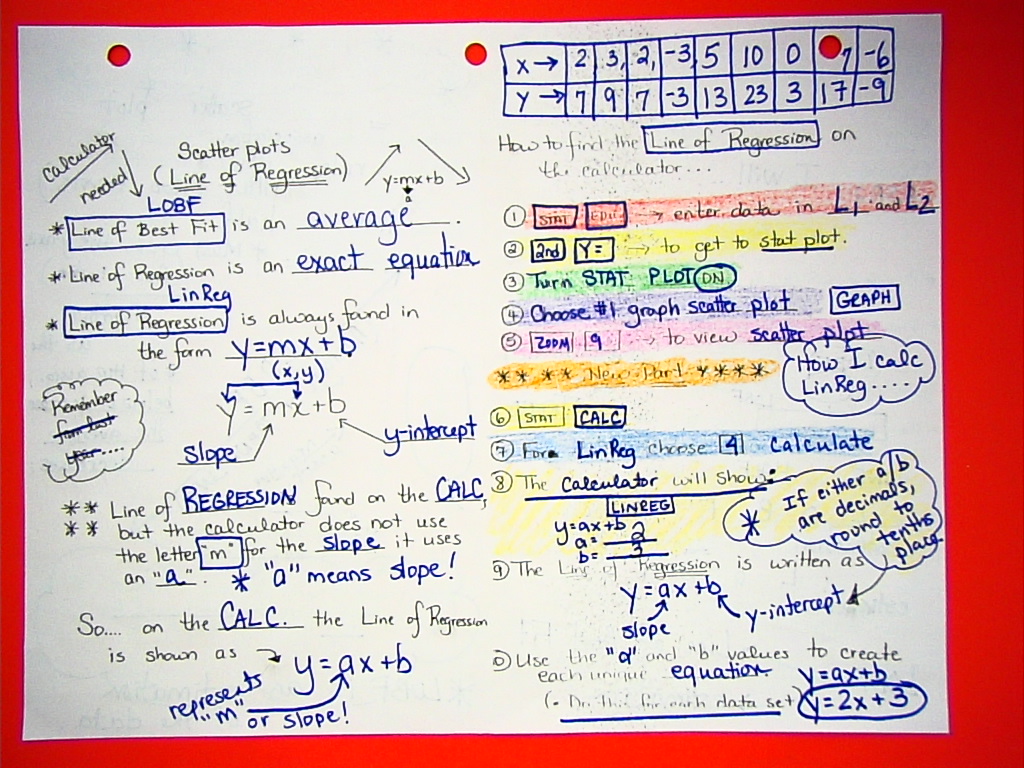
Wednesday 11-12-2014 Students will learn how to calculate the Line of Regression of a Scatterplot using the TI-84plus calculator to find LINREG. This lesson was an introduction to Line of Regression. 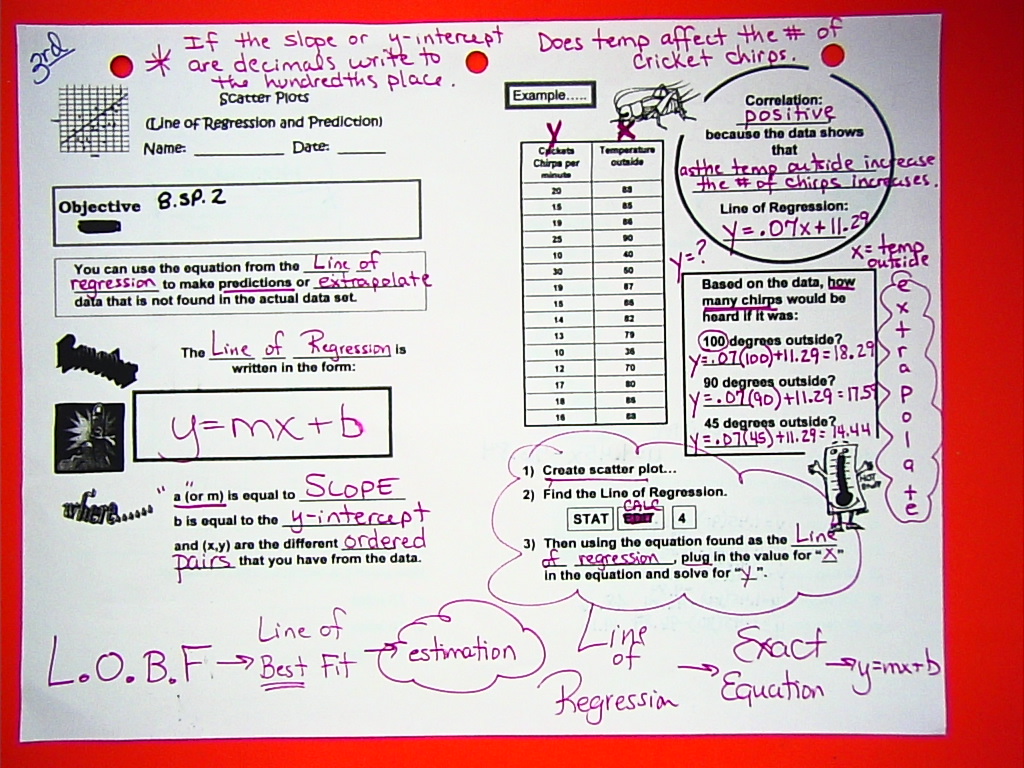
Thursday 11-13-2014
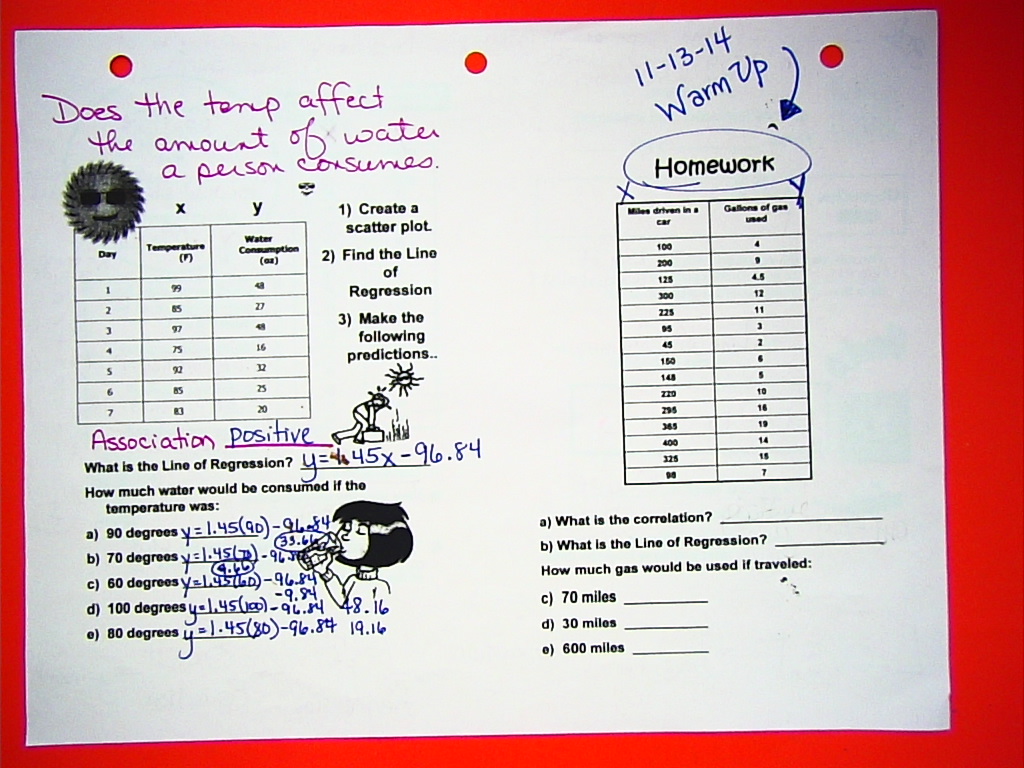
Students calculated the Line of Regression from four practice date tables. They were able to determine the association from each table, calculate the Line of Regression, and also use the equation from the Line of Regression to make predictions. Friday 11-14-2014
Students completed a Scatterplot assessment. |